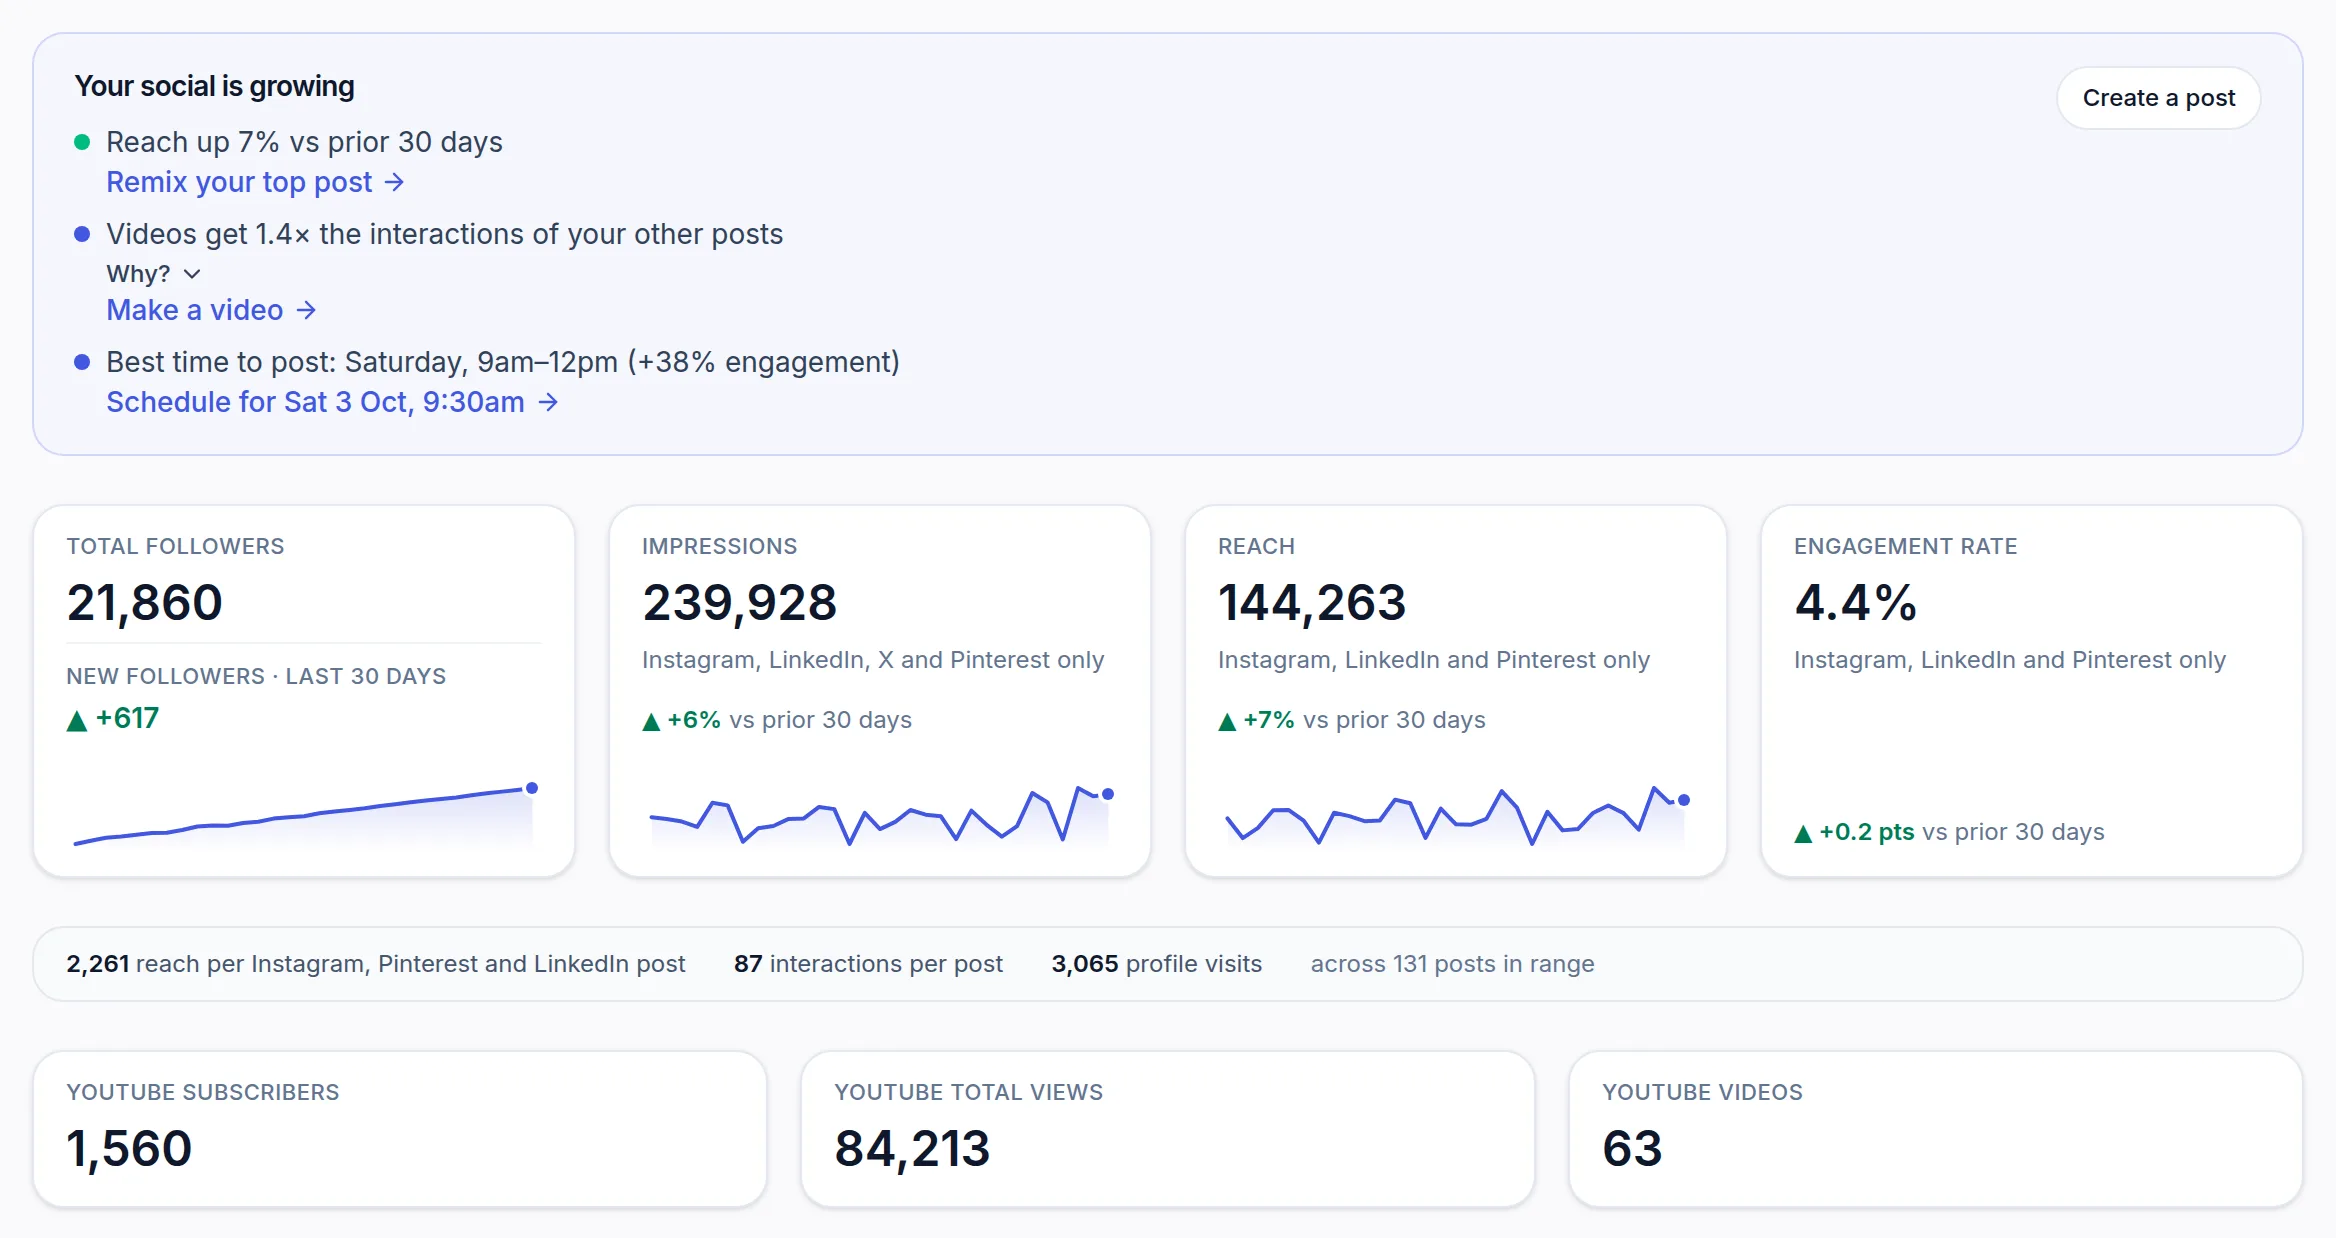
Optimate pulls performance data from your connected accounts so you can see how you're doing in one place — total followers, reach, impressions and engagement, plus post-level detail.
 (opens the full-size screenshot)
Choose a platform (or All) and a date range at the top. Overview, Trends, Timing and Top posts jump to each part of the page: the headline numbers, followers and engagement day by day, the days and hours your posts do best, and the posts that did best.
If you've connected a YouTube channel, a YouTube card adds the last 28 days of watch time, average view duration, subscribers gained and lost, where the views came from and which videos held attention.
Download saves the numbers as an Excel workbook or CSV files, in a web browser. Report builds a page of the period's numbers you can print or save as a PDF.
Data refreshes on a regular schedule. If you've just connected an account, give it a little time for the first sync to complete.